Solutions to Quiz 1#
Question 1
What is the primary role of an actuary, and what types of risks are typically associated with this role?
Solution to Question 1
Click to toggle answer
The main role of an actuary is to assess and manage financial risks, primarily in the fields of insurance, pensions, and investments. Actuaries use mathematical models to analyze the financial consequences of risk, helping companies and organizations make informed decisions. The types of risks commonly associated with this role include mortality risk (in life insurance), morbidity risk (in health insurance), longevity risk (in pensions), and investment risk (in asset management). Actuaries also deal with various other risks such as catastrophic events, regulatory changes, and economic fluctuations.
Summarized Points
The main role of an actuary is to assess and manage financial risks, primarily in the fields of insurance, pensions, and investments.
Actuaries use mathematical models to analyze the financial consequences of risk, helping companies and organizations make informed decisions.
Types of risks commonly associated with this role include:
Mortality risk (in life insurance)
Morbidity risk (in health insurance)
Longevity risk (in pensions)
Investment risk (in asset management)
Actuaries also deal with various other risks such as:
Catastrophic events
Regulatory changes
Economic fluctuations
Question 2
How does an aging population potentially impact an insurance company’s operations and financial performance?
Solution to Question 2
Click to toggle answer
An aging population can impact an insurance company in various ways. As individuals age, they may require more healthcare services, leading to higher health insurance claims. Additionally, the increased prevalence of chronic illnesses and age-related conditions can drive up costs for insurers. While mortality risk does increase with age, life insurance premiums are usually adjusted accordingly to mitigate the impact on payouts. However, the demand for other insurance products, such as long-term care insurance, may increase as individuals require assistance with daily activities in their later years. Furthermore, an aging population can affect an insurance company’s investment strategies, as they may need to manage their portfolios more conservatively to ensure stability and liquidity. Overall, the aging population presents both challenges and opportunities for insurance companies, necessitating adjustments in product offerings, pricing, and investment approaches to effectively manage risks and meet the evolving needs of customers.
Summarized Points
Aging population affects insurance companies in various ways:
Increased demand for healthcare services leads to higher health insurance claims.
Rising prevalence of chronic illnesses and age-related conditions escalates costs for insurers.
Although mortality risk rises with age, life insurance premiums are adjusted to offset potential impacts on payouts.
Demand for long-term care insurance may surge as individuals require assistance with daily activities in later years.
Aging population influences insurance companies’ investment strategies, prompting more conservative portfolio management for stability and liquidity.
Overall, the aging population presents both challenges and opportunities for insurance companies:
Necessitates adjustments in product offerings, pricing, and investment approaches.
Requires effective risk management to meet evolving customer needs while maintaining financial stability.
Question 3
For each of the following tasks in actuarial science, determine whether the analysis requires the application of probability or statistical inference:
Assessing the likelihood of a policyholder experiencing a certain type of claim within the next year.
Evaluating the effectiveness of a new risk management strategy implemented by an insurance company.
Estimating the average lifespan of a specific demographic group based on historical data.
Calculating the chances of a policyholder renewing their insurance policy at the end of the coverage period.
Testing whether there is a significant difference in claims frequency before and after the introduction of a new insurance product.
Determining the risk of a catastrophic event, such as a natural disaster, occurring within a given geographic region in the next decade.
Solution to Question 3
Click to toggle answer
Assessing the likelihood of a policyholder experiencing a certain type of claim within the next year.
Answer: Probability
Explanation: This task involves calculating the likelihood of a specific event (a policyholder experiencing a claim) occurring within a defined time frame (the next year). Probability is used to quantify the likelihood of such events happening.
Evaluating the effectiveness of a new risk management strategy implemented by an insurance company.
Answer: Statistical Inference
Explanation: This task involves comparing data before and after implementing the new risk management strategy to determine if there is a significant difference in outcomes. Statistical inference, such as hypothesis testing, is used to draw conclusions about the effectiveness of the strategy based on sample data.
Estimating the average lifespan of a specific demographic group based on historical data.
Answer: Statistical Inference
Explanation: This task involves drawing conclusions about a population (the average lifespan of a demographic group) based on sample data (historical lifespan data). Statistical inference techniques, such as confidence interval estimation, are used to estimate population parameters and quantify uncertainty.
Calculating the chances of a policyholder renewing their insurance policy at the end of the coverage period.
Answer: Probability
Explanation: This task involves quantifying the likelihood of a specific event (policy renewal) occurring based on historical data or other relevant factors. Probability is used to assess the chances of policyholders renewing their policies.
Testing whether there is a significant difference in claims frequency before and after the introduction of a new insurance product.
Answer: Statistical Inference
Explanation: This task involves comparing data from two different time periods (before and after the introduction of a new insurance product) to determine if there is a significant difference in claims frequency. Statistical inference techniques, such as hypothesis testing, are used to assess whether any observed differences are statistically significant.
Determining the risk of a catastrophic event, such as a natural disaster, occurring within a given geographic region in the next decade.
Answer: Probability
Explanation: This task involves assessing the risk of a rare event (a catastrophic event) occurring within a specific time frame (the next decade) and geographic area. Probability is used to estimate the likelihood of such events happening based on historical data, geographic factors, and other relevant information.
Question 4
For each of the following tasks in actuarial science, match them with the appropriate type of non-probability sampling method, simple random sampling, stratified random sampling, or cluster sampling:
Assessing the mortality rates of policyholders aged 65 and above in a particular insurance portfolio, sampled randomly from each age group.
Estimating the average claim amount for policyholders in different geographic regions, selecting policyholders randomly from each region.
Analyzing the distribution of policy durations for a specific insurance product, sampling policyholders randomly from the entire customer base.
Evaluating the effectiveness of a new underwriting guideline on a subset of policyholders with high-risk profiles, selecting policyholders based on specific risk assessment criteria.
Estimating the proportion of policyholders who have multiple insurance policies with the company, selecting policyholders randomly from the entire customer base.
Assessing the satisfaction levels of policyholders with different types of insurance products offered by the company, selecting policyholders randomly from each product category.
Determining the risk of a catastrophic event, such as a natural disaster, occurring within a given geographic region in the next decade, selecting geographic regions as clusters and sampling from each cluster.
Solution to Question 4
Click to toggle answer
Assessing the mortality rates of policyholders aged 65 and above in a particular insurance portfolio, sampled randomly from each age group.
Stratified Random Sampling
Explanation: Stratified random sampling divides the population into homogeneous subgroups (age groups in this case) and samples randomly from each subgroup. This ensures representation from each age group, allowing for accurate estimation of mortality rates within each group.
Estimating the average claim amount for policyholders in different geographic regions, selecting policyholders randomly from each region.
Stratified Random Sampling
Explanation: Similar to the first scenario, stratified random sampling is used here because the population (policyholders) is divided into subgroups (geographic regions) and samples are taken randomly from each subgroup. This approach ensures representation from each region, allowing for accurate estimation of average claim amounts for different regions.
Analyzing the distribution of policy durations for a specific insurance product, sampling policyholders randomly from the entire customer base.
Simple Random Sampling
Explanation: Simple random sampling involves randomly selecting individuals from the entire population without any stratification. In this scenario, policyholders are sampled randomly from the entire customer base, allowing for an unbiased assessment of the distribution of policy durations for the specific insurance product.
Evaluating the effectiveness of a new underwriting guideline on a subset of policyholders with high-risk profiles, selecting policyholders based on specific risk assessment criteria.
Non-probability Sampling Methods
Explanation: Non-probability sampling methods involve selecting individuals based on subjective criteria rather than random selection. In this scenario, policyholders are selected purposively based on specific risk assessment criteria, rather than randomly. This approach may introduce bias into the sample, as it does not ensure representation from the entire population.
Estimating the proportion of policyholders who have multiple insurance policies with the company, selecting policyholders randomly from the entire customer base.
Simple Random Sampling
Explanation: Similar to scenario 3, simple random sampling is used here because policyholders are sampled randomly from the entire customer base without any stratification. This approach ensures an unbiased estimation of the proportion of policyholders with multiple insurance policies.
Assessing the satisfaction levels of policyholders with different types of insurance products offered by the company, selecting policyholders randomly from each product category.
Stratified Random Sampling
Explanation: Again, stratified random sampling is used because the population (policyholders) is divided into subgroups (product categories) and samples are taken randomly from each subgroup. This approach ensures representation from each product category, allowing for accurate assessment of satisfaction levels across different types of insurance products.
Determining the risk of a catastrophic event, such as a natural disaster, occurring within a given geographic region in the next decade, selecting geographic regions as clusters and sampling from each cluster.
Cluster Sampling
Explanation: Cluster sampling involves dividing the population into clusters (geographic regions in this case) and sampling from each cluster. This approach is suitable when the population is naturally grouped into clusters, such as geographic regions, and it is impractical or costly to sample individuals from each cluster.
Question 5
Given a figure that illustrates the survey by the UTCC’s Center for Economic and Business Forecasting, which surveyed 1,256 respondents across the country from April 2018-2022. Respondents had less than 15,000 baht in monthly income. The survey is conducted annually, except in 2020 when the lockdown prevented the survey from being carried out.
What is the population?
Describe the sample used for this report.
Identify the variables used to collect this information.
What do you think the expansion of 29.6% in year 2021 means?
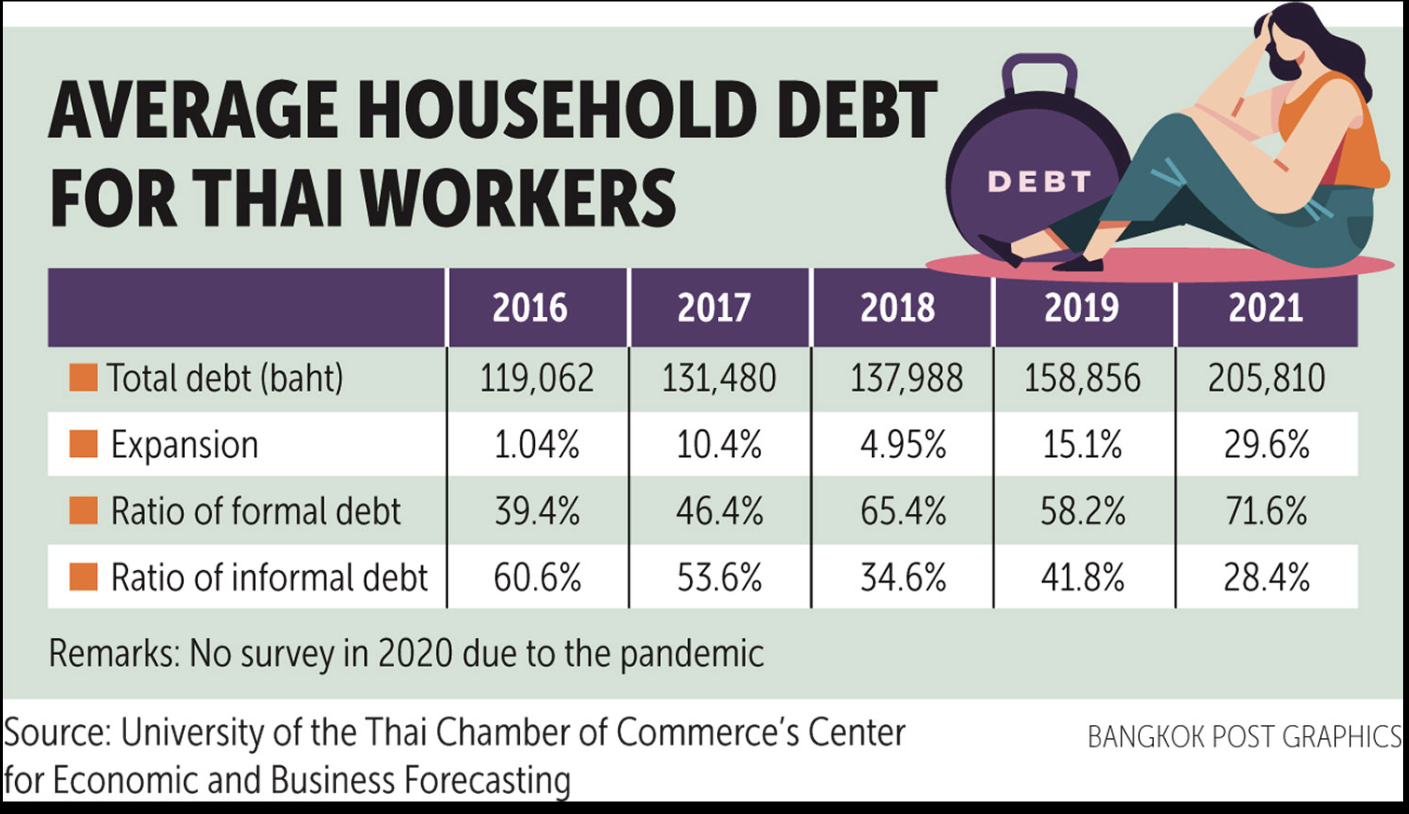
Fig. 21 Average household debt for Thai workers: the survey by the UTCC’s Center for Economic and Business Forecasting#
Solution to Question 5
Click to toggle answer
What is the population?
The population refers to all individuals or entities that the survey aims to represent or draw conclusions about. In this case, the population consists of individuals across the country who have a monthly income of less than 15,000 baht.
Describe the sample used for this report.
The sample refers to the subset of the population that was surveyed or included in the study. In this survey, the sample consists of 1,256 respondents across the country who met the criteria of having a monthly income of less than 15,000 baht. The survey was conducted annually from April 2018 to 2022, except in 2020 due to lockdown restrictions.
Identify the variables used to collect this information.
The variables are the characteristics or factors that were measured or observed in the survey. In this survey, the variables include Total debt (in baht), Expansion (as a percentage), Ratio of formal debt, and Ratio of informal debt. These variables were collected annually from 2018 to 2022.
What do you think the expansion of amount of debts compared to the previous years means?
The expansion of the amount of debts, indicated by a 29.6% increase in 2021 compared to 2019, suggests a significant rise in the level of debt compared to previous years. This increase could indicate various economic trends, such as higher borrowing, increased consumption, or changes in lending practices. Further analysis would be necessary to understand the reasons behind this expansion and its potential implications for the surveyed population.