1. Introduction to Data Science
“Learning from data is virtually universally useful. Master it and you will be welcomed anywhere.” — John Elder, Elder Research
1.1. What is data science?
https://www.analytixlabs.co.in/blog/data-science-process/
Data Science is an associated field of Big Data that focuses on analyzing enormous amounts of complicated and raw data to provide valuable information to businesses. In order to analyze and present data for effective decision making by executives, various subjects such as statistics, mathematics, and computation are combined. Data Science enables businesses to improve performance, productivity, and customer satisfaction while making it easier to meet their financial goals. However, a thorough understanding of the Data Science process is essential for Data Scientists to successfully apply Data Science and deliver helpful, productive results. The many stages of the Data Science process help transform data into useful results. It helps in more efficient analysis, extraction, visualization, storage, and management of data.
https://ischoolonline.berkeley.edu/data-science/what-is-data-science/
Data Science continues to be one of the most promising and sought-after career paths for qualified individuals. Today’s effective data scientists recognize that they must go beyond the traditional skills of large-scale data analysis, data mining, and programming. Data Scientists must be proficient across the spectrum of the data science lifecycle and possess a level of flexibility and awareness to maximize returns at each stage of the process to produce meaningful insights for their organizations.
The term “data scientist” was introduced in 2008 when companies recognized the need for data experts capable of organizing and analyzing massive amounts of data.
https://www.simplilearn.com/a-day-in-the-life-of-a-data-scientist-article
A Data Scientist is a specialist in statistics, data science, Big Data, R programming, Python, and SAS, and a job as a Data Scientist offers many opportunities and a high income. According to Harvard Business Review, Data Science is the most attractive job of the twenty-first century. Data Scientist has been named the best job in the United States by Glassdoor, with a job rating of 4.8 out of 5 and a satisfaction rate of 4.2 out of 5. The average base salary is $110,000, and there are currently hundreds of openings, with many more to come: By 2020, IBM predicts a 28 percent increase in demand for Data Scientists.
1.2. A day in the life of a data scientist
Let us take a look at how a day in the life of a data scientist goes while working on a data science project.
1.2.1. Business problem
First and foremost, it’s critical to understand the business problem. In meetings with clients, the data scientist asks relevant questions, understands, and defines objectives for the problem that needs to be solved.
https://www.analytixlabs.co.in/blog/data-science-process/
Asking questions like these can help you get through this process.
Who are the customers?
How can they be identified?
How is the sales process going right now?
Why are they interested in your products?
What products are they interested in?
To turn numbers into insights, You need much more context to the numbers to understand them. By the end of this phase, you should have as much information as possible.
1.2.2. Data acquisition
In the next step, the data scientist prepares for data acquisition, gathering and scraping data from multiple sources, including web servers, databases, APIs, and online archives. It appears that collecting the proper data takes both time and work.
1.2.3. Data preparation
Once the data has been collected, the next phase is data preparation, which involves data cleaning and transformation. The most time-consuming step is data cleaning, which deals with a variety of challenging conditions. The data scientist is responsible for data types that are not consistent. In data transformation, the data scientist modifies the data based on defined mapping rules. The project uses extract, transform, and load (ETL) tools such as Talend and Informatica to perform complex transformations that help the team better understand the data structure.
Below are the most common mistakes to watch out for:
Values that are missing
Values that have been manipulated, such as invalid entries
Differences in time zones
Errors related to the date range, such as a transaction that was recorded before the sale even started, are common.
You also need to look at the aggregate of all rows and columns in the file to determine if the results are correct. If they are not, you will need to delete or change the incorrect data.
1.2.4. Exploratory data analysis
It is very important to understand what you can do with your data. The data scientist performs exploratory data analysis (EDA). Using EDA, the data scientist defines and refines the selection of feature variables to be used in model development.
1.2.5. Data modeling
This step is where your knowledge of math, statistics, and technology comes in handy. To properly analyze the data and gain all possible insights, you will need to use all available data science tools. You may need to create a predictive model that compares your average customer to customers who are less successful. Several factors, such as age or social media engagement, could prove to be crucial elements in your research to predict who will buy a service or product.
Python is preferred for modeling the data but it can also be done using R and SAS.
1.2.6. Visualization and communication
After all these processes, it is crucial that you share your findings and insights with the sales manager and convince him of their importance. It is to your advantage to communicate well in order to accomplish the task assigned to you. Clear and concise communication will lead to action. Improper contact, on the other hand, can lead to inaction. Tools such as Tableau, Power Bi, and QlikView can be used to create powerful reports and dashboards.
You need to link the data you have collected and your insights to the sales manager’s knowledge so that they can understand it better. Start by discussing why a product is not performing well and why certain demographics are not responding to the sales pitch. After you have laid out the problem, you can move on to the solution. You need to write a compelling story with clear goals and objectives.
“If you can’t explain it simply, you don’t understand it well enough.” — Albert Einstein
1.2.7. Deployment and maintainance
In the final phase, the data scientist deploys and maintains the model. The selected model is tested in a pre-production environment before being deployed in the production environment, which is the best practice.
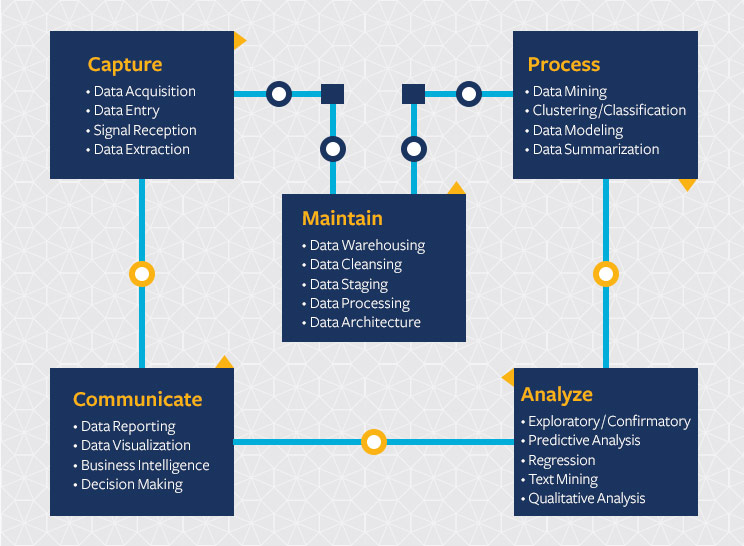
1.3. Data science life cycle
A Data Science lifecycle is a series of Data Science steps that you go through to complete a project or analysis. Because each Data Science project and team is unique, each Data Science lifecycle is also unique. However, most data science projects follow a similar generic data science life cycle.
The following diagram represents the five phases of the data science life cycle (from the School of Information, Berkeley: https://ischoolonline.berkeley.edu/data-science/what-is-data-science/):
Another useful infographic about the lifecycle of a data science project from SuperDataScience is given below (Data science life cycle: from SuperDataScience):

1.4. What is the difference between a data analyst, a data engineer, and a data scientist?
https://www.dataquest.io/blog/data-analyst-data-scientist-data-engineer/ https://www.edureka.co/blog/data-analyst-vs-data-engineer-vs-data-scientist/ https://www.simplilearn.com/tutorials/data-science-tutorial/data-scientist-vs-data-analyst-vs-data-engineer https://ischoolonline.berkeley.edu/data-science/what-is-data-science/
Data has always been crucial to any decision-making process. Today’s world is entirely based on data, and no business could operate without data-driven strategic planning and decision making. Because of its invaluable insights and trust, data is used in a variety of professions in the industry today. In this section, we explore the important differences and similarities between a data analyst, a data engineer, and a data scientist.
Data Scientist
Data Scientists are concerned with what questions need to be answered and where to find the relevant data. They have analytical and business acumen, as well as the ability to extract, cleanse, and present data. They help companies find, organize, and analyze large amounts of unstructured data. Also, they use advanced data techniques to derive business insights, such as clustering, neural networks, decision trees, etc. The results are then summarized and distributed to key stakeholders to help the business make strategic decisions.
The following are examples of the work of data scientists:
Evaluating statistical models to determine the validity of analyzes.
Using machine learning to develop better predictive algorithms.
Testing and continuously improving the accuracy of machine learning models.
Creating data visualizations to summarize the results of advanced analysis.
Skills needed: Programming (SAS, R, Python), statistical and mathematical skills, storytelling and data visualization, Hadoop, SQL and machine learning are also required skills.
Data Analyst
In a data analytics team, data analysts are the entry-level position. They add value to their business by collecting data, analyzing it, and sharing the results to support business decisions. Cleaning data, performing analysis, and developing data visualizations are common tasks for data analysts.
The title of data analyst can vary by industry (e.g., business analyst, business intelligence analyst, operations analyst, database analyst). Regardless of the designation, the data analyst is a generalist who can work in a variety of roles and teams to help others make better data-driven decisions.
The specific skills required will vary depending on the needs of the business, but below are some general tasks:
Cleaning and organizing unprocessed data.
Using descriptive statistics to get an overview of the data
Identifying and analyze significant data trends.
Creating visual representations and dashboards to support data interpretation and decision making.
Providing technical analysis results to business customers or internal teams.
Skills needed: Programming skills (SAS, R, Python), statistical and mathematical skills, data manipulation and data visualization are required.
Data Engineer
Data engineers are responsible for managing vast amounts of data that is constantly changing. They work to create data pipelines and infrastructures, deploy, manage, and optimise to transform and deliver data to data scientists and data analysts to perform their work.
The mindset of a data engineer is often more focused on building and optimizing. The responsibilities of a data engineer include, but are not limited to, the following:
Creating APIs for data usage.
Integrating external or new data sets into existing data pipelines.
Applying feature transformations for machine learning models to new data.
Continuous monitoring and testing of the system to ensure optimal performance.
Skills needed: Programming languages (Java, Scala), NoSQL databases (MongoDB, Cassandra DB) and frameworks are required (Apache Hadoop).
Summary of the various tools and skills required by a Data Analyst/Data Engineer/Data Scientist (from MathaMagicians, https://mathamagicians.co/differences-between-a-data-analyst-data-scientist-and-data-engineer/)

The 365 Data Science team created the What-Where-Who infographic in response to the need for a simple explanation of data science. They define the key data science processes and promote the field. Their viewpoint on data science is as follows. For more detail, please visit https://365datascience.com/career-advice/career-guides/defining-data-science/ and https://www.youtube.com/watch?v=edZ_JYpOM8U.

1.5. The data in data science
There is always data before anything else. Data is the raw material on which all analysis is built, and it is the cornerstone of data science. In data science, there are two types of data: traditional data and big Data.
Traditional data is organized and stored in databases that analysts can access from a single computer, and it is in tabular form with numeric or text values. We use the term “traditional” only for clarity. It clarifies the distinction between Big Data and other forms of data.
Big Data, on the other hand, is much more extensive than traditional data. It comes from many different sources (numbers, text, but also photos, audio and mobile data).
Relational database management systems are used to store traditional data. Big data, on the other hand, is kept on multiple servers and is significantly more complex.
1.5.1. Where does data come from?
Traditional data sources include simple customer records and historical stock price data.
Big data, on the other hand, is all around us. Big data is being used and generated by more and more companies and industries. These include:
Think of internet networks like Facebook, Google and LinkedIn, and data from financial transactions.
Temperature measurement networks in different geographic regions and machine data from sensors in industrial equipment, are examples of Big Data.
There is also wearable technology.
1.5.2. Where is data science applied in the world of data?
1.5.2.1. Where is Business Intelligence used?
Business intelligence is used in sales, marketing, finance and operations. Quantitative analysis, monitoring performance against business goals, gaining customer insights and sharing data to uncover new opportunities are just some of the tasks.
Analyst and data scientist:
Analysts are BI experts who use consolidated enterprise data along with powerful analytical tools to determine where improvements can be made and what strategic recommendations they can make to management.
Marketing:
Marketers can use business intelligence products to track campaign analytics from a central digital location. BI systems can track campaigns in real time, analyze their effectiveness, and plan future initiatives. This information provides marketing teams with a better understanding of overall performance, as well as contextual images to share with the rest of the organization.
Finance:
BI professionals can extract insights from financial data and combine it with operational, marketing, and sales data to make decisions and understand factors that affect profit and loss.
Sales:
For quick access to complicated information such as discount analysis, customer profitability, and customer lifetime value, sales data analysts and operations managers often use BI dashboards and key performance indicators (KPIs). Sales managers use dashboards with reports and data visualizations to track revenue goals, sales force performance, and the state of the sales pipeline.
Operations:
Managers can access and evaluate data such as supply chain analytics to find methods to optimize processes to save time and resources. Business intelligence can also help improve distribution channels and ensure compliance with service level agreements.
1.5.3. Where does data science apply?
The applications for the relevant methods are extremely diverse; data science is rapidly making its way into a wide range of businesses. However, four important areas should be included in the discussion.
Data Science and User Experience (UX) When a company launches a new product, it typically conducts surveys to determine how customers feel about it. After the BI team creates its dashboards, it must analyze the data by segmenting the observations (e.g., by region) and then analyzing each segment independently to derive useful prediction. The results of these operations often support the notion that in order to maximize consumer happiness,the product must have small but significant differences in each segment to maximize consumer satisfaction.
Sales Volume Prediction This form of analysis uses time series analysis. The data scientist wants to know what will happen in the next sales period or a year from now based on the sales data collected up to that point. They use mathematical and statistical models to run multiple simulations that present future scenarios to the analyst. This is the core of data science because based on these scenarios, the company can make better forecasts and apply appropriate strategies.
Fraud detection Banks can use machine learning, especially supervised learning, to collect historical data, categorize transactions as valid or fraudulent, and train fraud detection models. When these models detect even the slightest hint of theft, they flag the transactions and intervene in real time to prevent the fraud.
Customer Engagement Businesses can use machine learning algorithms to figure out which customers are likely to buy their products. This means that the store can efficiently offer discounts and a “personal touch,” which lowers marketing spend and increases revenue. Google and Amazon are two big names that come to mind.
1.6. Cases studies: Examples of data science applications
Expedia: Business intelligence improves customer experience
Expedia is the parent company of Expedia, Hotwire and TripAdvisor, all of which are leading travel companies.
The challenge: Customer satisfaction is critical to the company’s purpose, strategy and long-term success. The online experience should reflect an enjoyable trip, but the company does not have access to the voice of the customer.
The solution: the company was manually collecting tons of data, leaving little time for analysis. The customer satisfaction group was able to examine customer data from across the company using business intelligence and link the results to ten goals that were directly related to the company’s priorities. KPI managers create, monitor, and analyze data to identify trends or patterns.
The results: The customer care team can monitor their performance against the KPIs in real time and make adjustments as needed. In addition, the data can be used by other departments. For example, a travel manager can use BI to identify large volumes of unsold tickets or offline bookings and develop tactics to change behavior and increase overall savings.
Lotte.com: Business intelligence boosts revenue With 13 million customers, Lotte.com is the Korea’s largest online shopping mall.
The challenge: With more than 1 million page views daily, company executives wanted to know why customers abandon their shopping carts.
The solution: Customer Experience Analytics, Korea’s first online behavioral analytics system, was implemented by the assistant general manager of the marketing planning team. The manager used the information to better analyze customer behavior, conduct targeted marketing and redesign the website.
The results: After one year, customer loyalty was up and sales were up $10 million, driven by insights from the new analytics program, BI. Adjustments resulted from identifying and correcting the causes of abandoned purchases, such as a lengthy checkout process and unexpected delivery times.
1.7. Use Cases: Examples of Data Science applications that prominent companies use
Netflix: With 148 million members, the Internet entertainment company has a significant BI advantage. What is Netflix’s approach to business intelligence? Netflix uses data in a variety of ways. For example, the company develops and tests new programming concepts based on shows already watched. Business intelligence is also used by Netflix to encourage users to interact with its content. The service is so good at promoting targeted material that its recommendation system is responsible for over 80% of all streamed content.
Tesla: The forward-thinking automaker uses BI to wirelessly connect its vehicles to its corporate offices and collect data for research. This method connects the automaker to the customer and allows it to anticipate and fix problems such as component damage, traffic and hazard data. The result is high customer satisfaction and the selection of future improvements and goods is based on better information.
Uber: The company uses business intelligence to identify a variety of key components of its operations. One example is surge pricing. Algorithms continuously monitor traffic conditions, ride times, driver availability and customer demand, and adjust prices as demand increases and traffic conditions change. Airlines and hotel companies use real-time dynamic pricing to adjust costs to meet demand.
1.8. This video on “What is Data Science” from Simplilearn
This video on “What is Data Science” will give you an idea of what the life of a Data Scientist is like. This video on Data Science for Beginners also explains the process of a Data Science project, its many applications, and the positions and salaries of a Data Scientist.
from IPython.display import IFrame, YouTubeVideo, SVG, HTML
# https://www.youtube.com/watch?v=X3paOmcrTjQ
YouTubeVideo('X3paOmcrTjQ',640,360)